What is a Gantt chart? Definition from Digimagg
A Gantt chart visually represents project tasks, milestones, and progress, aiding in project planning and management.

A Gantt chart is a visual representation of a project schedule, displaying start and end dates of project elements. It was developed by Henry Gantt (1861-1919), an American engineer.
Understanding Gantt chart
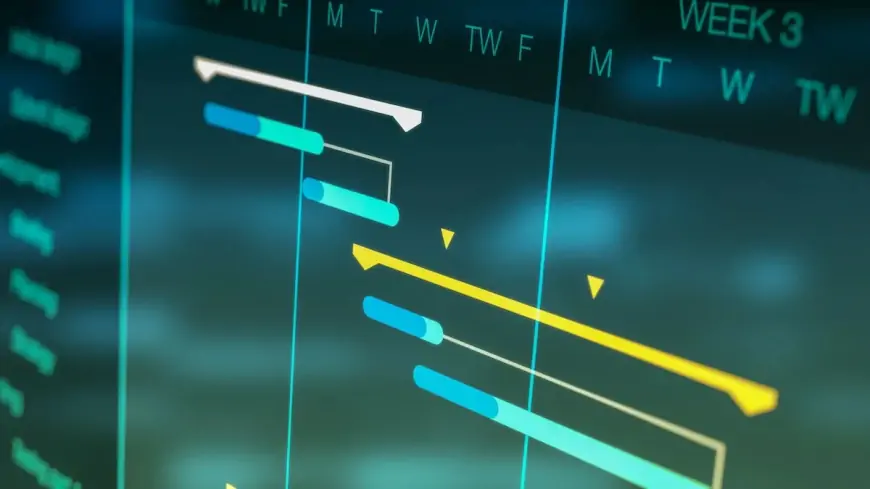
The Gantt chart, widely utilized in project management, serves as a crucial tool for planning and sequencing tasks. Typically presented as a horizontal bar chart, it visually represents the project timeline, including task sequences, durations, start and end dates. Each horizontal bar denotes task completion progress. Gantt charts facilitate scheduling, management, and monitoring of project tasks and resources. They enable project managers to communicate task status and completion rates effectively, ensuring project alignment and adherence to timelines. Conventionally embraced across the engineering and project management sectors, Gantt charts promote unified communication practices.
Illustration of a Gantt chart
Company A undertakes a project to implement new software on a large investment bank's servers. Employing a Gantt chart for project management, tasks such as research, software selection, testing, and installation are depicted as vertical lines. A key milestone is the software selection.
With a project duration of 40 days, each task spans 10 days, sequentially dependent. Notably, software testing in development and test environments is a critical activity.
Horizontal bars on the Gantt chart represent task start/end dates, duration, milestones, and the percentage of completion. Utilizing this tool aids Company A in scheduling tasks across a 40-day timeline for successful project completion.
Advantages of using a Gantt chart
The chart identifies tasks that can run concurrently and those dependent on others' completion. It aids in spotting bottlenecks and tasks overlooked in the project timeline. It also illustrates factors like task slack time, noncritical activities with potential delays, and critical activities crucial for on-time execution. Gantt charts are versatile tools applicable to projects of various scales and types, from infrastructure projects like dams and bridges to software development. Project management software such as Microsoft Visio, Project, SharePoint, and Excel, or specialized tools like Gantto or Matchware, facilitate Gantt chart creation.
Overview of Henry Gantt
Henry Gantt, a management consultant with a mechanical engineering background, was also a social scientist. He focused on scientific management, devising strategies to enhance productivity within corporations and their employees. In the early 1910s, he introduced the Gantt chart as a tool to assist supervisors in tracking labor progress and ensuring task adherence to schedules.
Applications of Gantt chart
Gantt charts help visualize various tasks and projects that occur simultaneously within an organization, and how far along they have progressed. They are used by management to plan and schedule such projects so that resources can be allocated in an optimal way and that projects that are prioritized can finish before less important ones begin.
What components constitute a Gantt chart?
A Gantt chart may differ in complexity, yet it consistently comprises three essential elements: tasks or activities listed on the y-axis, milestones or progress stages marked on the x-axis (located either at the top or bottom of the chart), and horizontal bars representing progress, indicating the status of each task at any particular moment.


