


What is Data Analysis? Your 2024 career guide
Data analysis involves examining, cleaning, transforming, and interpreting data to extract insights and inform decision-making.

The Significance of Data Analysis in the Contemporary Digital Landscape
In the age of digital transformation, the importance of data analysis has escalated significantly. The proliferation of data stemming from digital technologies has given rise to the concept of 'big data.' This immense volume of data, when appropriately analyzed, holds the potential to offer invaluable insights capable of revolutionizing businesses.
Data analysis serves as the gateway to unlocking the potential inherent in big data. It enables organizations to decipher this data, transforming it into actionable insights. These insights can drive enhancements in products and services, elevate customer experiences, optimize operations, and boost profitability.
For instance, consider the healthcare sector. Through data analysis, healthcare providers can anticipate disease outbreaks, enhance patient care, and make well-informed decisions regarding treatment approaches. Likewise, within the finance industry, data analysis can aid in risk evaluation, fraud detection, and the formulation of investment strategies.
Understanding Data Analysis
Data analysis is a comprehensive approach to examining, refining, altering, and modeling data with the aim of uncovering valuable insights, making informed decisions, and supporting decision-making processes. It encompasses a diverse set of techniques and methodologies to interpret data sourced from various origins, regardless of format, whether structured or unstructured.
More than just a process, data analysis serves as a pivotal tool empowering organizations to make well-grounded decisions, predict trends, and enhance operational efficacy. It forms the bedrock of strategic planning across industries, spanning businesses, governmental entities, and other organizational sectors.
Consider, for instance, a prominent e-commerce enterprise. By leveraging data analysis, they can grasp their clientele's purchasing behaviors, inclinations, and trends. Subsequently, they can utilize this knowledge to tailor customer experiences, forecast sales, and refine marketing strategies, thereby fostering business expansion and customer contentment.
Explore further insights on how to embark on a career as a data analyst in our dedicated resource, which comprehensively addresses the essentials of entering this field and the requisite skills to hone.
The Process of Analyzing Data:
Setting Objectives and Formulating Questions
The initial phase of the data analysis process involves establishing clear objectives and crafting precise questions that the analysis seeks to address. This step is pivotal as it lays the groundwork for the entire procedure. It entails grasping the issue or scenario at hand, pinpointing the requisite data, and delineating the metrics or benchmarks for gauging outcomes.
Gathering Data
Following the delineation of objectives and questions, the subsequent stage entails gathering pertinent data. This can be accomplished through an array of methods such as surveys, interviews, observations, or extraction from existing databases. The data amassed may comprise quantitative (numeric) or qualitative (non-numeric) information, contingent upon the nature of the problem and the queries posed.
Data Cleansing
Data cleansing, or data cleaning, emerges as a critical phase within the data analysis continuum. It encompasses scrutinizing the data for inaccuracies and disparities, and rectifying or eliminating them as necessary. This step safeguards the integrity and dependability of the data, which is indispensable for deriving precise and meaningful insights from the analysis.
Analyzing the Data
Once the data is purified, the subsequent step involves the actual analysis. This encompasses employing statistical or mathematical methodologies to scrutinize the data, unveiling patterns, correlations, or trends. An assortment of tools and software, such as Python, R, Excel, and specialized platforms like SPSS and SAS, are available for this purpose.
Interpreting and Visualizing the Data
Following data analysis, the subsequent phase involves deciphering the outcomes and presenting them visually in a comprehensible manner. This may entail crafting charts, graphs, or other visual depictions of the data. Data visualization facilitates the simplification of intricate data and furnishes a lucid portrayal of the findings.
Crafting a Narrative from the Data
The concluding phase in the data analysis process entails storytelling with the data. This involves articulating the analysis findings in a narrative format that is both captivating and comprehensible. Data storytelling is pivotal for communicating the results to non-technical audiences and for facilitating data-informed decision-making.
Data Analysis Tools
Excel
Microsoft Excel stands out as one of the most prevalent tools for data analysis, renowned for its assortment of features facilitating data manipulation, statistical analysis, and visualization. Its user-friendly interface and adaptability make it suitable for a wide spectrum of data analysis tasks, ranging from straightforward to intricate.
To initiate your journey with Excel, explore our Data Analysis in Excel course, designed to cultivate practical skills in leveraging Excel for data analysis. For a broader understanding of spreadsheet skills, consider exploring Marketing Analytics in Spreadsheets. Additionally, refer to our Excel Basics cheat sheet, offering a concise overview of fundamental formulas and operations to kickstart your Excel proficiency.
R
R is a programming language and open-source software environment explicitly crafted for statistical computing and graphics. Renowned among statisticians and data miners, R is extensively utilized for developing statistical software and conducting data analysis. It offers a diverse array of statistical and graphical techniques, encompassing linear and nonlinear modeling, classical statistical tests, time-series analysis, and more.
To begin your exploration of R, delve into our R Programming skill track, designed to acquaint you with the language and foster the essential skills required for coding in R. Furthermore, with our Data Analyst with R career track, you'll acquire the proficiencies necessary to embark on your journey towards becoming a competent data analyst. Don't forget to utilize our Getting Started with R cheat sheet, providing an overview of how to initiate your learning journey in R Programming.
Python
In the domain of data analysis, a plethora of tools exist to address diverse requirements, complexities, and skill levels. These tools encompass programming languages such as Python and R, as well as visualization software like Power BI and Tableau. Let's explore a selection of these tools.
Python stands out as a high-level, versatile programming language highly favored by data analysts and scientists. Its ease of use and clear syntax, combined with an extensive array of libraries such as pandas, NumPy, and Matplotlib, render it a top choice for both data analysis and visualization tasks.
To commence your Python learning journey, explore our Python Fundamentals skill track, encompassing essential foundational skills necessary for comprehending the language. Additionally, embark on our Data Analyst with Python career track to initiate your path towards becoming a proficient data analyst. Don't forget to utilize our Python for beginners cheat sheet as a convenient reference tool.
Power BI
Power BI, developed by Microsoft, stands as a business analytics tool offering interactive visualizations along with self-service business intelligence capabilities. It facilitates the conversion of raw data into actionable insights through intuitive dashboards and reports.
Dive into the capabilities of Power BI through our Power BI Fundamentals skill track, which equips you with the essential knowledge to leverage this business intelligence tool effectively. Additionally, with Exploratory Data Analysis in Power BI, you'll discover methods to enrich your reports through EDA techniques. For a quick reference guide, utilize our Power BI cheat sheet covering the fundamental concepts to kickstart your journey.
Tableau
Tableau serves as a robust data visualization tool widely utilized in the Business Intelligence sector. It enables the creation of interactive and shareable dashboards, presenting data trends, variations, and density through charts and graphs.
To kickstart your Tableau journey, explore our Tableau Fundamentals skill track, providing an introduction to the business intelligence tool and demonstrating how to manipulate, analyze, and visualize data effectively. Additionally, delve into Analyzing Data in Tableau to gain advanced skills aimed at enhancing your analytics and visualizations. For a quick reference guide, refer to our Tableau cheat sheet, offering an overview of essential steps to begin utilizing the tool.
SQL
SQL (Structured Query Language) serves as the standard language for overseeing and controlling databases. It is employed to retrieve and manipulate data housed in relational databases, playing a pivotal role in tasks related to data management and manipulation within databases.
To acquaint yourself with SQL, explore our SQL Fundamentals skill track, providing guidance on interacting with and querying data. Additionally, elevate your business SQL skills through our SQL for Business Analysts course. For quick reference, refer to our SQL Basics cheat sheet, offering a comprehensive list of functions for data querying, filtering, aggregation, and more.
Categories of Data Analysis
Predictive Analysis
Predictive analysis utilizes statistical models and forecasting methods to gain insights into future occurrences. It entails leveraging historical data to anticipate potential future outcomes. This form of analysis finds applications in areas such as risk evaluation, marketing, and sales projection.
For instance, a business might employ predictive analysis to anticipate sales for the upcoming quarter by examining past data trends.
Descriptive Analysis
Descriptive analysis, as its name implies, elucidates and summarizes raw data to render it comprehensible. It encompasses examining historical data to comprehend past occurrences.
This form of analysis serves to uncover patterns and trends that have unfolded over time.
For instance, a company may employ descriptive analysis to grasp the average monthly sales figures over the preceding year.
Prescriptive Analysis
Prescriptive analysis stands as the most sophisticated form of data analysis. It not only forecasts future outcomes but also proposes actions to capitalize on these predictions. Utilizing advanced tools and technologies such as machine learning and artificial intelligence, it offers recommendations for decision-making.
For instance, a prescriptive analysis could recommend optimal marketing strategies to enhance forthcoming sales.
Diagnostic Analysis
Diagnostic analysis surpasses descriptive analysis by delving into the underlying reasons behind occurrences. It entails intricate data examination and the comparison of diverse datasets to elucidate the causative factors behind a specific outcome.
For example, in the event of a decline in sales for a specific month, diagnostic analysis could be employed to ascertain the contributing factors.
Data Analysis Techniques
Data analysis encompasses various techniques, each serving distinct purposes and applications. Below, we'll explore some commonly utilized methods, including exploratory analysis, regression analysis, Monte Carlo simulation, factor analysis, cohort analysis, cluster analysis, time series analysis, and sentiment analysis.
Sentiment Analysis
Sentiment analysis, also referred to as opinion mining, employs natural language processing, text analysis, and computational linguistics to detect and extract subjective information from source materials. Common applications include social media monitoring, brand assessment, and interpreting customer feedback.
To gain proficiency in sentiment analysis using Python, consider enrolling in our online course. It provides comprehensive instruction on conducting end-to-end sentiment analysis tasks.
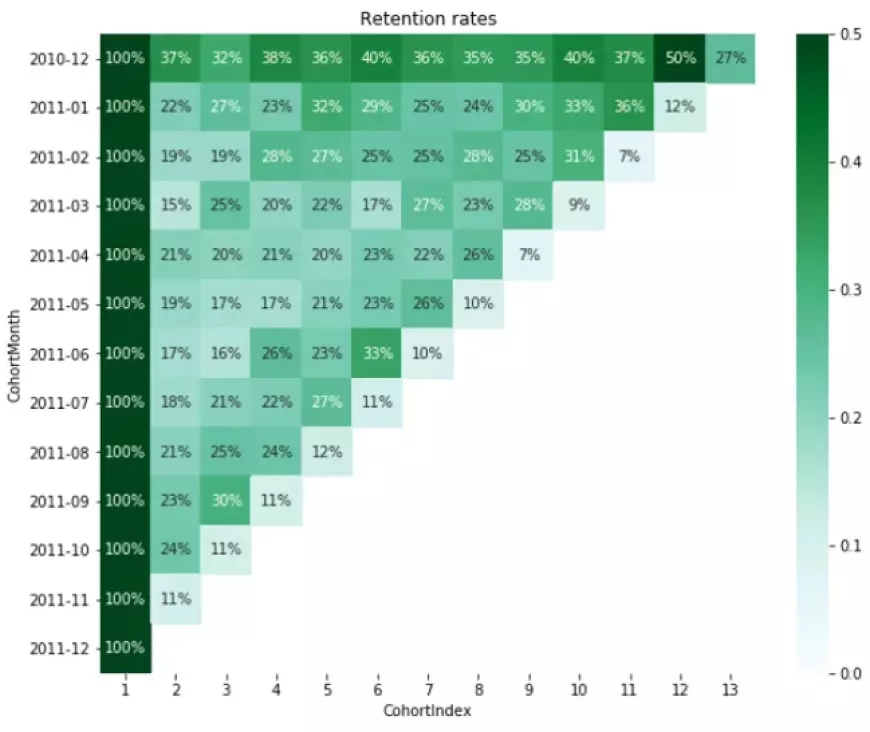
Cohort Analysis
Cohort analysis, a subset of behavioral analytics, entails grouping data from a specific dataset into related sets, or cohorts, for examination. These cohorts typically exhibit shared characteristics over a defined time period. This method finds application in marketing, user engagement assessment, and analyzing customer lifecycle.
Our course, "Customer Segmentation in Python," delves into various techniques for segmenting and scrutinizing customer data, including cohort analysis.
Factor Analysis
Factor analysis is a method employed to condense a vast array of variables into a smaller set of factors. These factors are crafted to encapsulate the utmost information attainable from the original variables. This method is frequently utilized in market research, customer segmentation, and image recognition.
Discover more about factor analysis in R through our course, which delves into latent variables like personality, utilizing both exploratory and confirmatory factor analyses.
Cluster Analysis
Cluster analysis is a method utilized to organize a collection of items in a manner where items within the same group, termed clusters, exhibit greater similarity to each other than to those in other clusters. This technique finds applications in market segmentation, image segmentation, and recommendation systems.
Delve into various clustering techniques, such as hierarchical clustering and k-means clustering, in our Cluster Analysis course in R.
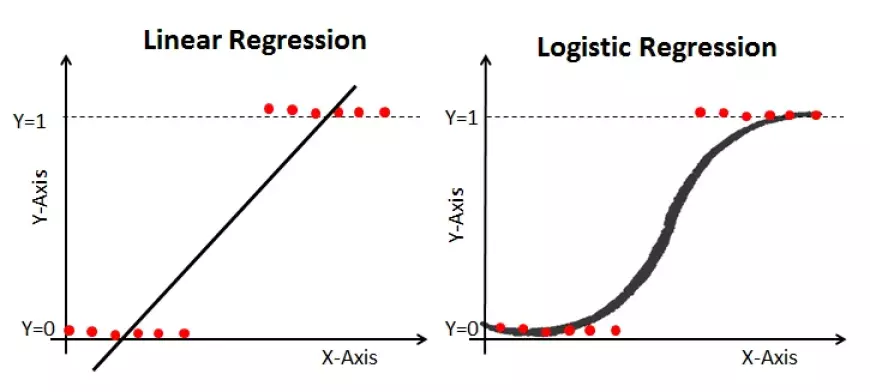
Regression Analysis
Regression analysis is a statistical approach employed to comprehend the connection between a dependent variable and one or more independent variables. This method is frequently utilized for prediction, time series modeling, and elucidating causal relationships between variables.
Explore the fundamentals of linear regression, one of the most prevalent regression algorithms in fields such as machine learning, through our tutorial.
Exploratory Analysis
Exploratory analysis is employed to grasp the fundamental traits of a dataset. Typically utilized at the outset of a data analysis endeavor, it aims to outline the primary features of the data, detect missing data, and validate assumptions. This method employs visual techniques like scatter plots, histograms, and box plots.
Enhance your understanding of exploratory data analysis with our course, which delves into exploring, visualizing, and extracting insights from data using Python.
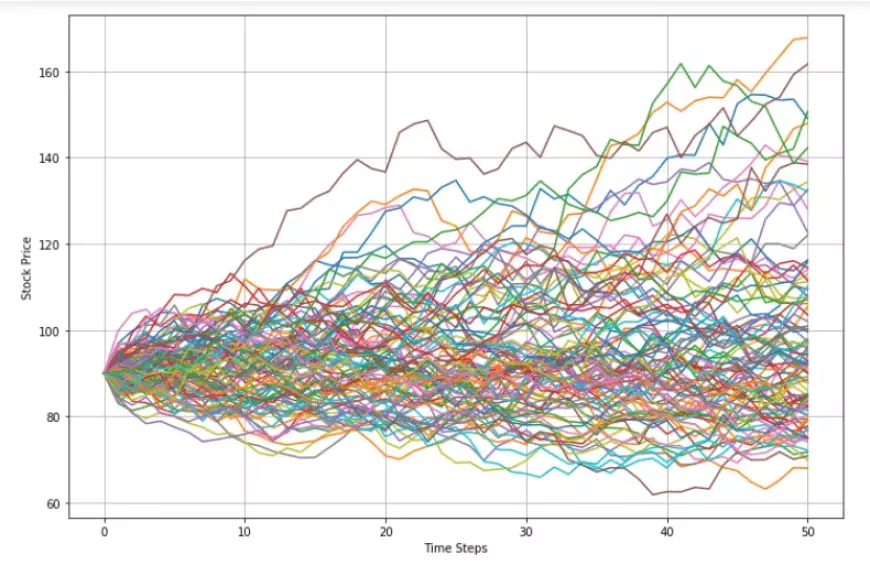
Monte Carlo Simulation
Monte Carlo simulation involves utilizing probability distributions and random sampling to approximate numerical outcomes. This method is commonly applied in scenarios involving risk analysis and decision-making under considerable uncertainty.
Explore Monte Carlo methods in R through our tutorial, and also consider our Python course on Monte Carlo simulations, which enables the estimation of a spectrum of outcomes for uncertain events.
Time Series Analysis
Time series analysis is a statistical method focusing on time series data, which involves analyzing data trends over time. It aims to extract significant statistics and other features from the sequence of data points. This approach finds application in sales forecasting, economic forecasting, and weather forecasting.
Embark on our Time Series with Python skill track to learn how to handle and analyze time series data effectively, utilizing various Python libraries.
How does comprehending the influence of data analysis entail?
How does data analysis, regardless of its scale, exert a substantial influence on business outcomes, fostering enhancements in productivity, heightened profitability, and a more comprehensive grasp of market dynamics and consumer actions?
Effects on sizable corporations
In the case of larger enterprises, data analysis can have a deeper impact. Analyzing big data can unveil intricate patterns and trends that would otherwise remain hidden, potentially leading to significant breakthroughs and fostering innovation, thus providing the company with a competitive advantage.
For instance, a major retailer might employ data analysis to enhance its supply chain, resulting in cost savings and heightened operational efficiency. Alternatively, a technology firm might leverage data analysis to gain insights into user behavior, ultimately enhancing product design and increasing user engagement.
Effects on small-scale enterprises
Even basic data analysis can yield substantial enhancements for small businesses. For instance, scrutinizing sales data enables the identification of high-performing products and areas for improvement. This data can subsequently inform adjustments in marketing tactics, pricing strategies, and inventory management, resulting in enhanced sales and profitability.
Making decisions based on well-informed insights
Data analysis allows businesses to make informed decisions based on facts, figures, and trends, rather than relying on guesswork or intuition. It provides a solid foundation for strategic planning and policy-making, ensuring that resources are allocated effectively and that efforts are directed towards areas that will yield the most benefit.
The crucial significance of data analysis
In the contemporary data-centric environment, the capacity to analyze and interpret data stands as a pivotal skill. Enterprises proficient in leveraging data analysis are more adept at adjusting to evolving market dynamics, addressing customer demands, and fostering both growth and profitability.
Prominent Career Paths in Data Analysis in 2024
Amidst the age of Big Data, careers within the realm of data analysis are thriving. Fueled by the growing need for data-driven insights, these occupations present bright opportunities. In this discussion, we will outline some of the leading careers in data analysis in 2023, drawing from our comprehensive guide on the top ten analytics professions.
Role: Business Intelligence Analyst
Business intelligence analysts play a pivotal role in elucidating a business's performance through thorough analysis of market trends, operational procedures, and competitive landscapes. Utilizing various tools and software, they transform intricate data into comprehensible reports and dashboards, facilitating informed decision-making for stakeholders.
Key Skills:
Robust analytical abilities
Proficiency in SQL and other database technologies
Familiarity with data warehousing and ETL processes
Capability to generate lucid visualizations and reports
Business acumen
Essential Tools:
SQL
Power BI, Tableau
Excel
Python, R
Role: Business Analyst
Business analysts serve as intermediaries between IT and business stakeholders, leveraging data to evaluate processes, identify requirements, and provide data-driven insights and reports to executives and stakeholders. They contribute to strategic planning, analyze business models, design processes, and conduct system analysis.
Key Skills:
Effective analytical capabilities
Comprehensive understanding of business processes and strategies
Proficiency in SQL
Excellent communication skills for engaging with both IT and business stakeholders
Proficient in project management
Essential Tools:
SQL
Excel
Power BI, Tableau
Python, R
Role: Data Engineer
Data engineers play a pivotal role in constructing and maintaining the data pipeline. They are responsible for designing, building, installing, testing, and upkeeping highly scalable data management systems. Additionally, they ensure data cleanliness, reliability, and preprocessing to facilitate data analysis by data scientists.
Key Skills:
Expertise in SQL and NoSQL databases
Understanding of distributed systems and data architecture
Familiarity with ETL tools and processes
Proficient programming skills, especially in Python and Java
Knowledge of machine learning algorithms
Essential Tools:
SQL, NoSQL
Hadoop, Spark
Python, Java
ETL tools
Role: Data Scientist
Data scientists serve as the investigators of the data realm, unraveling patterns, insights, and trends from extensive datasets. They leverage a blend of programming, statistical expertise, and machine learning to interpret complex data sets. Moreover, data scientists not only analyze data but also utilize their findings to inform strategic decisions within their organization.
For detailed guidance on embarking on a career as a data scientist, refer to our comprehensive guide.
Key Skills:
Proficiency in programming languages such as Python or R
Solid understanding of statistics and probability
Knowledge of machine learning algorithms
Competence in data wrangling and data cleaning
Ability to effectively communicate complex data insights
Essential Tools:
Python, R
SQL
Jupyter Notebook
Machine learning libraries like Scikit-learn, TensorFlow
Data visualization libraries like Matplotlib, Seaborn
| Career | Key Skills | Essential Tools |
| Business Intelligence Analyst | Robust analytical capabilities, expertise in SQL, comprehension of data warehousing and ETL processes, proficiency in generating visualizations and reports, and possessing business acumen. | SQL, Power BI, Tableau, Excel, Python |
| Business Analyst | Solid analytical capabilities, comprehension of business procedures, adeptness in SQL, efficient communication, and proficient project management abilities. | SQL, Excel, Power BI, Tableau, Python |
| Data Engineer | Expertise in SQL and NoSQL, understanding of distributed systems and data architecture, acquaintance with ETL processes, programming proficiency, and comprehension of machine learning. | SQL, NoSQL, Hadoop, Spark, Python, Java, ETL tools |
| Data Scientist | Proficiency in coding, solid understanding of statistics, acquaintance with machine learning, adeptness in data wrangling, and effective communication abilities. | Python, R, SQL, Scikit-learn, TensorFlow, Matplotlib, Seaborn |
Beginning Your Data Analysis Journey
Embarking on your path to becoming a data analyst may initially appear intimidating, but with access to suitable resources and guidance, you can acquire the essential skills and expertise. Here are several steps to assist you in getting started, emphasizing the resources provided by DataCamp.
Grasping the fundamentals
Before delving into data analysis, it's crucial to comprehend the basics. This entails acquainting yourself with statistical principles, various data types, and data structures. DataCamp's courses like "Introduction to Data Science in Python" or "Introduction to Data Science in R" serve as excellent starting points.
Mastering a programming language
Proficiency in at least one programming language is essential for data analysis. Python and R stand out as popular choices owing to their versatility and extensive libraries tailored for data analysis. DataCamp offers comprehensive learning paths for both Python and R.
Refining data manipulation and visualization skills
Data manipulation and visualization play integral roles in data analysis, facilitating data cleaning, transformation, and visualization for easier comprehension and analysis. Courses such as "Data Manipulation with pandas" or "Data Visualization with ggplot2" aid in developing these competencies.
Exploring specialized data analysis techniques
Once you've grasped the fundamentals, you can delve into specific data analysis techniques such as regression analysis, time series analysis, or machine learning. DataCamp provides a diverse range of courses covering various topics, allowing you to specialize based on your interests and career aspirations.
Practicing consistently
Mastery in data analysis comes through practice. DataCamp's practice mode and projects offer hands-on experience with real-world data, enabling you to reinforce your learning and apply your skills effectively. Additionally, a compilation of 20 data analytics projects across all levels can serve as inspiration.
Keep in mind that learning data analysis is a progressive journey. It's acceptable to start small and gradually enhance your skills over time. With patience, perseverance, and access to the appropriate resources, you'll make significant strides toward becoming a proficient data analyst.


